This site provides access to publicly available FABRIC Metrics.
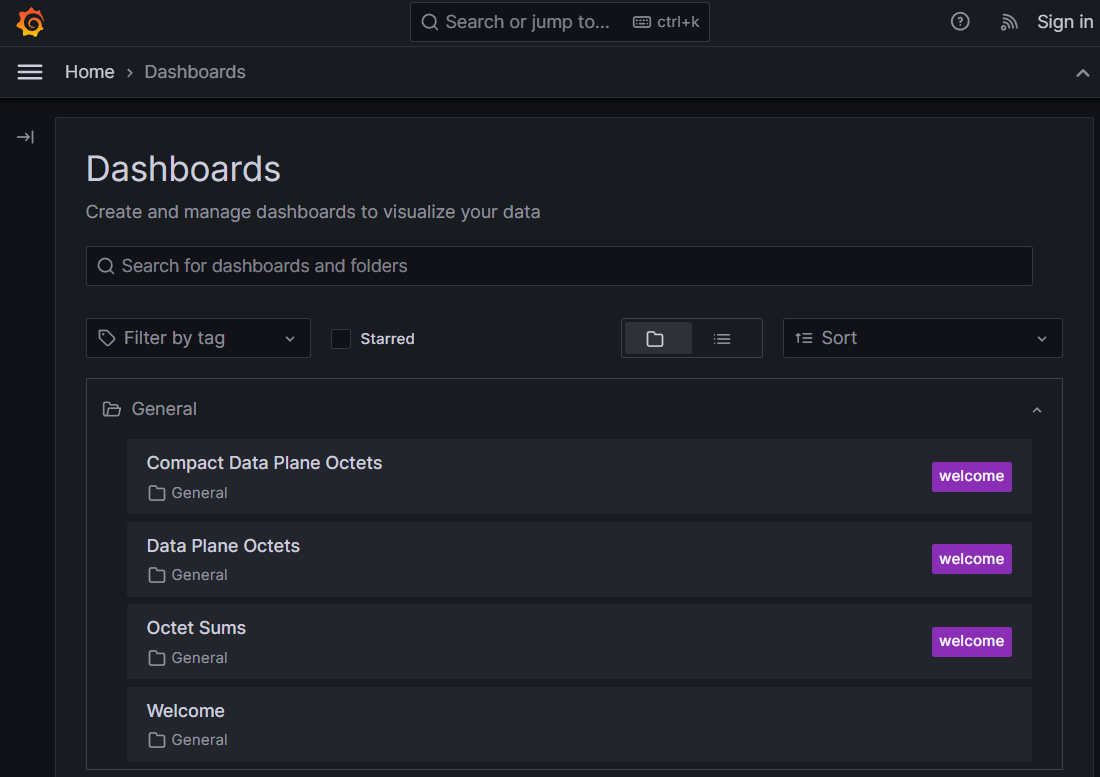
Go to the Public Metric's Grafana home page where you can view dashboards and explore metrics.
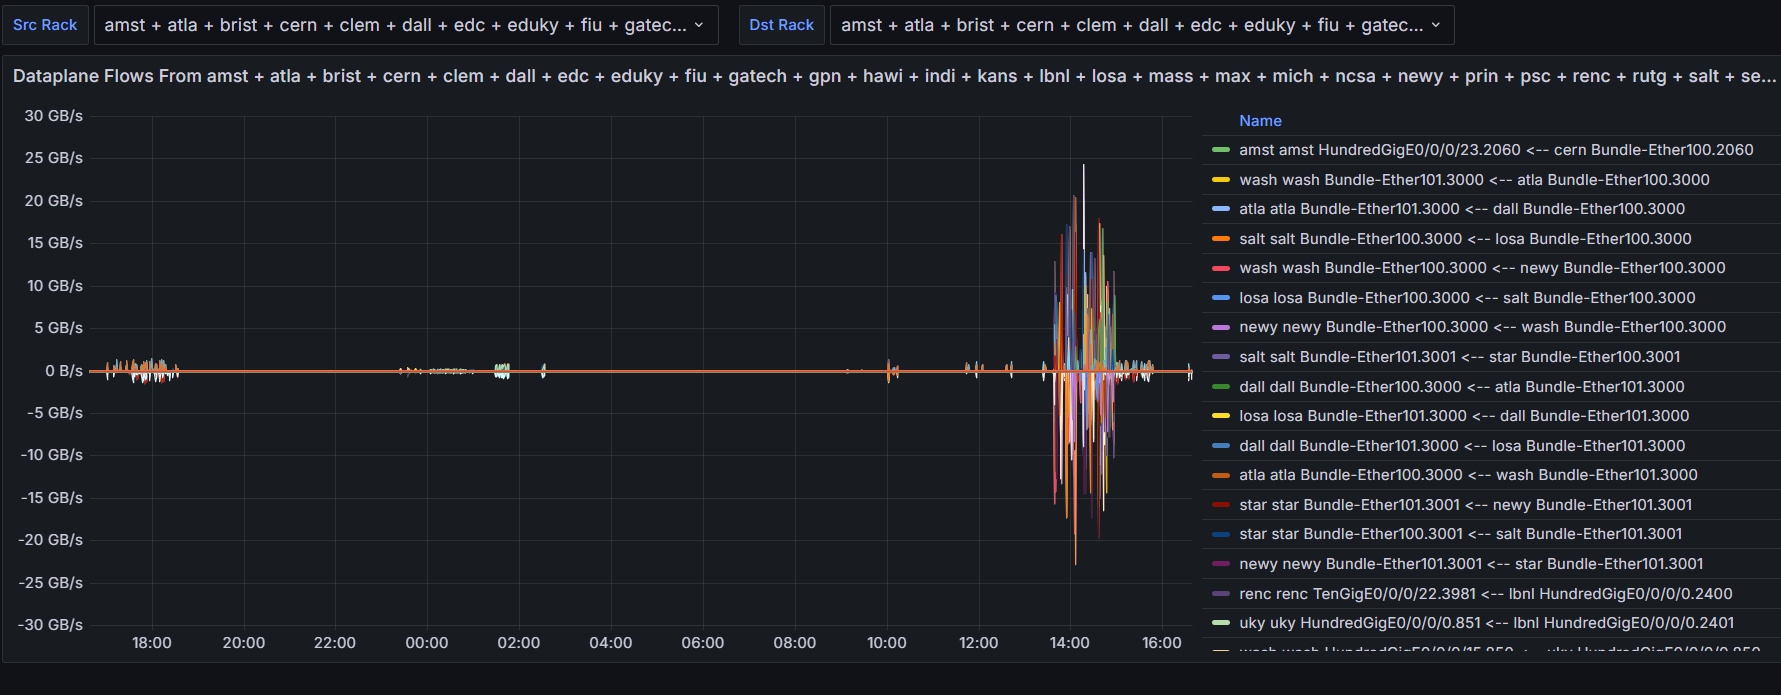
See the network traffic between adjacent (directly-connected) FABRIC racks. Select the source and/or destination rack(s) of interest to plot the bandwidth used during a specified time period.
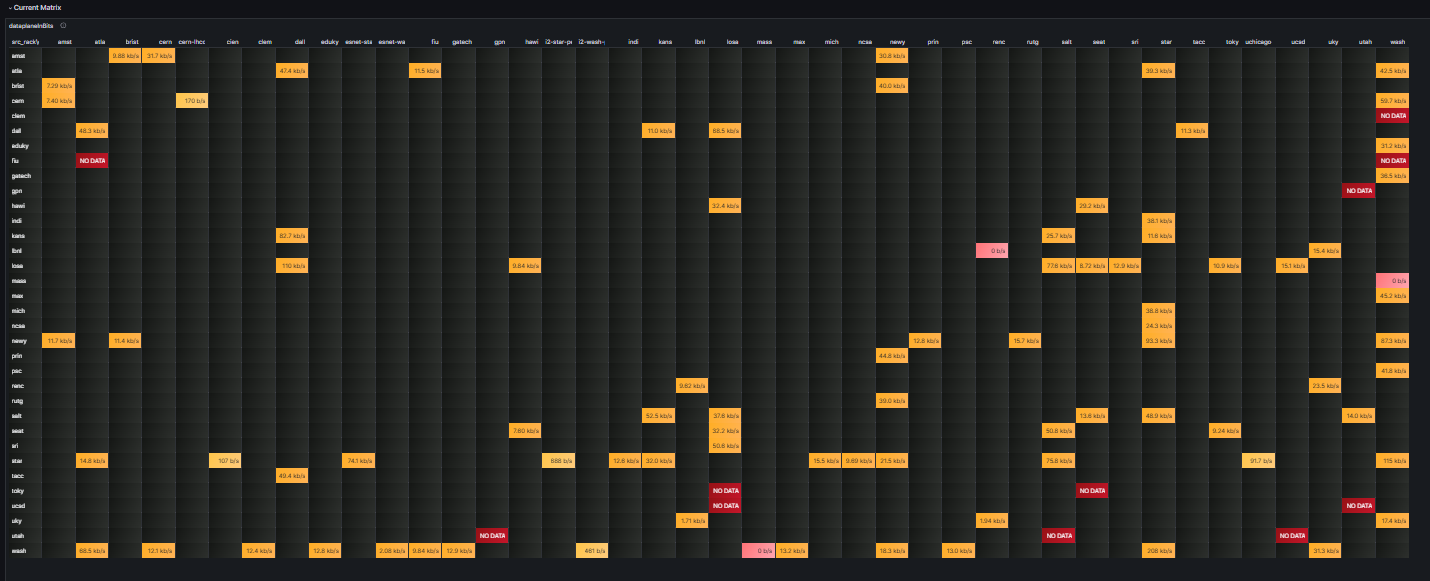
Display an overview of the current link status (usage and/or failure status) as a traffic matrix. The most used (Top) and least used (Bottom) links are shown at the bottom of the page.
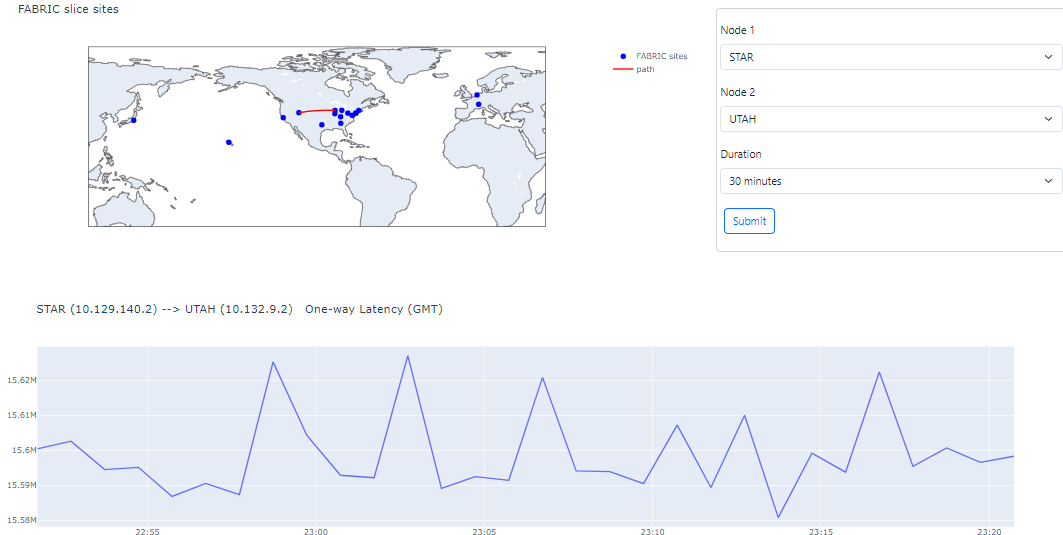
See one way latency (OWL) measurements between FABRIC racks equipped with GPS timing and precision time protocol(PTP).
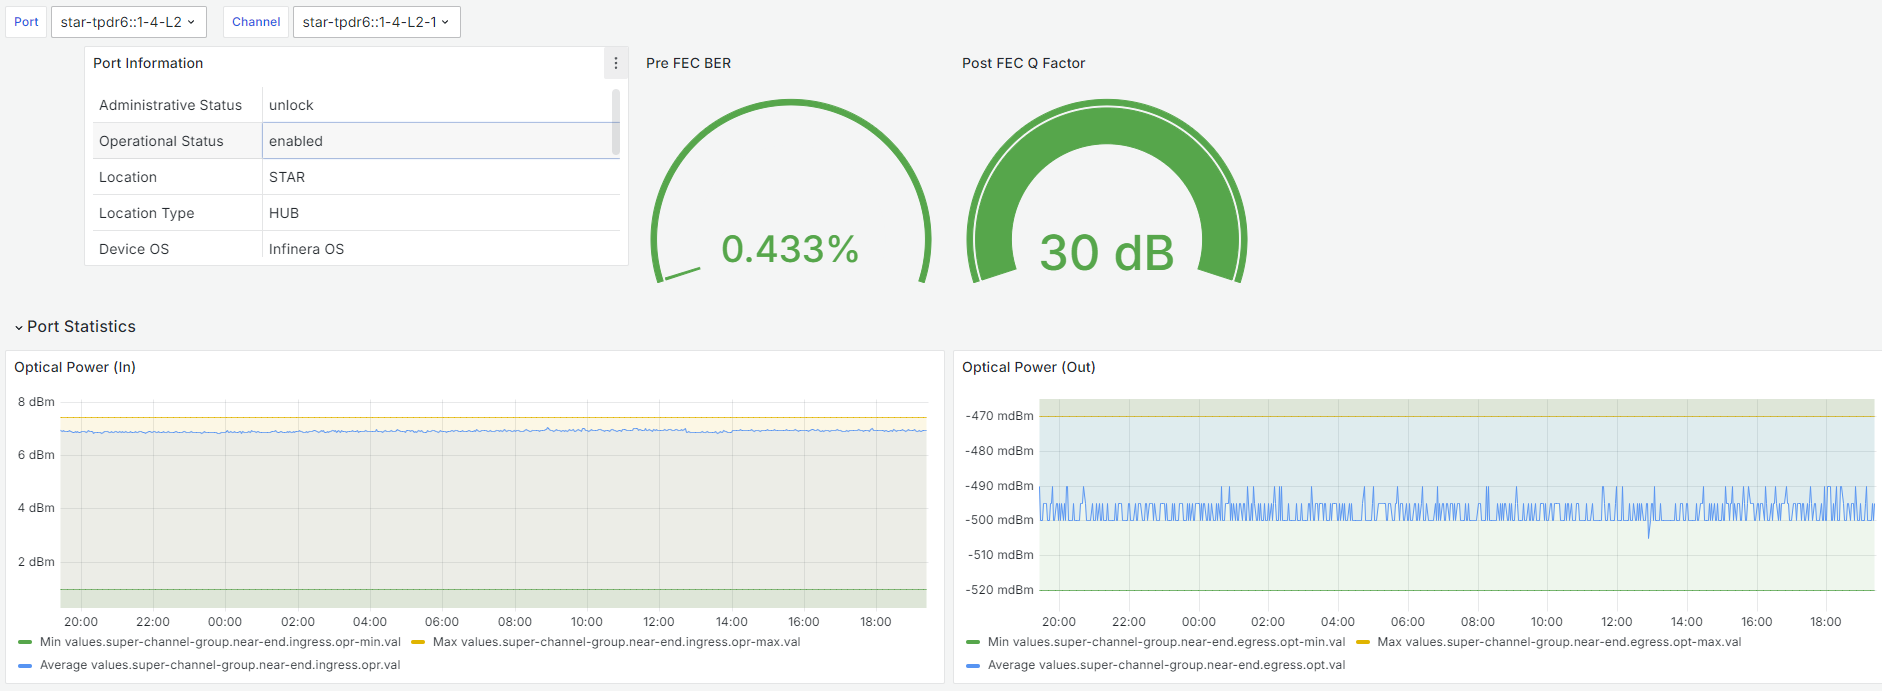
ESnet's public dashboards. which include Transporter Line Optical Statistics for FABRIC.